Portfolio

Conference talk
YouTube recording of my talk at the NHS-R Conference, November 2022. Introducing the package, and how to use it to simplify and standardise reporting using statistical process control.
https://www.youtube.com/watch?v=fWYehE5U6Vs&t=2862s
{SPCreporter}
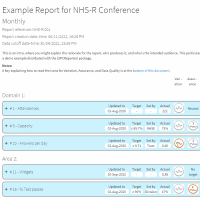
Code for my open-source R package {SPCreporter}, used to build a report for many timeseries metrics to support management decision-making. Charts are displayed as SPCs using the {NHSRplotthedots} package, and the report includes a simple summary view to make scanning a large amount of information for signals easy to do.
https://github.com/ThomUK/SPCreporter
{robson10classifier}
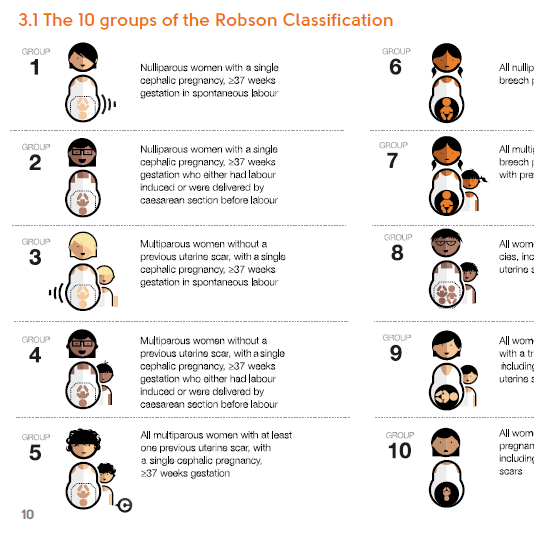
Code for my open-source R package {robson10classifier}, used to classify the delivery of babies into each of the 10 categories defined by the World Health Organisation.
https://github.com/ThomUK/robson10classifier

{MSDSpipeline}
Code for my open-source R package {MSDSpipeline}, used to download and join approx 800MB of publicly available maternity data into a form useable for timeseries plotting, and benchmarking. As supplied by NHS England the information is of very limited practical use to analysts, and this package endeavours to solve that problem.
https://github.com/ThomUK/MSDSpipeline
{NHSRplotthedots}
I am the maintainer of the open-source R package {NHSRplotthedots}, designed to make Statistical Process Control charts easy to create. In 2021 I needed to process a significant amount of data with SPC, and together with colleages from NHS Open Analytics Community created this package. As of 2026 it has been donwloaded 16,000 times, mainly by NHS data analysts to help improve UK healthcare decisions-making.
https://github.com/nhs-r-community/NHSRplotthedots
Quadrant icons
R code for making a full set of quadrant icons, as used in the {SPCreporter} package.
https://github.com/ThomUK/STAR-quadrant-icon-maker